Boosting Percona MySQL Operator efficiency
Preface
Percona is well known for its offer of several outstanding fully open source, free to download software packages. And while Percona started as a MySQL focus company, nowadays it covers different technologies such as MySQL, Postgres and Mongodb. 
In its constant effort to make life easier for our utilizer Percona had moved from providing single software packages, to Percona Distributions for MySQL, MongoDB and Postgres. Percona Distributions are a set of software packages that Percona has tested and certifies working together. That it easier to deploy architectural solutions requiring the use of multiple components, such as proxy, topology manager, backup software and more.
But we are going even further, and with the release of Percona Distribution for MySQL/MongoDB Operator we are providing a high level of automation to roll out and manage solutions based on Percona Distributions.
One of my tasks, as MySQL technical leader, is to identify optimal architectures to serve several common cases. Such as Percona Distribution for MySQL: High Availability with Group Replication Solution. Or in the case of Percona Distribution for MySQL Operator, identify the different dimensions (low/mid/high utilization) and suggest a Vanilla setup with the scope to get the most out of the solution deployed.
This is a long exercise, which started with a lot of internal discussions to identify what can make sense as traffic, then testing, identifying the saturation points, testing again and so on.
It is during this process that I found a small problem (Feature Request). This small issue is preventing us from easily and dynamically modifying some parameters in the checks the Operator uses. Given that we had to put the testing on hold until the above FR is implemented. As you can see it is a small thing but it will give us better control over the Operator behavior and will help to have a well tuned platform.
This article is to show the level of improvement you can have with small but targeted tuning.To do so I used the smallest solution we have identified. The solution is dimensioned to serve a small website or a simple application with low level of traffic.
The environment
To help identify a balanced setup we were using sysbench and sysbench-tpcc. The whole stack on GCP was composed of Application nodes with sysbench, 2 ProxySQL nodes for R/W split only, 3 VMS 8 CPU 32GB RAM, with the Percona operator managing the MySQL service.

Tests
For this specific test we were running 68 - 96 -128 - 256 threads:
- Sysbench read only
- Sysbench read/write
- Sysbench Tpc-c like
The tests were run multiple times and the data considered is the consolidation of the multiple runs.
We always run first on basic environments for baseline. Meaning no tuning for the MySQL or Operator, just dimension correctly disk space and BufferPool (and related).
Then we apply some tuning and run the tests multiple times eventually refining when/where needed.
The code can be found here and here
And now the results…
Sysbench r/w tests
I am not going to describe in detail the images that I think are clear enough. Just keep in mind on the left we have the results from our baseline, on the right the same tests on the same platform with the optimization applied.
Operations

Worth to mention that without tuning, the platform was not able to consistently scale up to 256 threads. While with a bit of adjustment not only it was able to serve 256 threads but we could have gone a bit further.
Reads

Writes

Comments
As you can see the sysbench tests clearly indicate that the platform with minor adjustment was acting better, and that it was able to serve more and with constant scaling. Let me add that almost all the tests runned on the “basic” platform had incidents, meaning as soon as the traffic was increasing, Sysbench was reporting connection interruptions or errors.
TPC-C
Operations

Reads

Writes
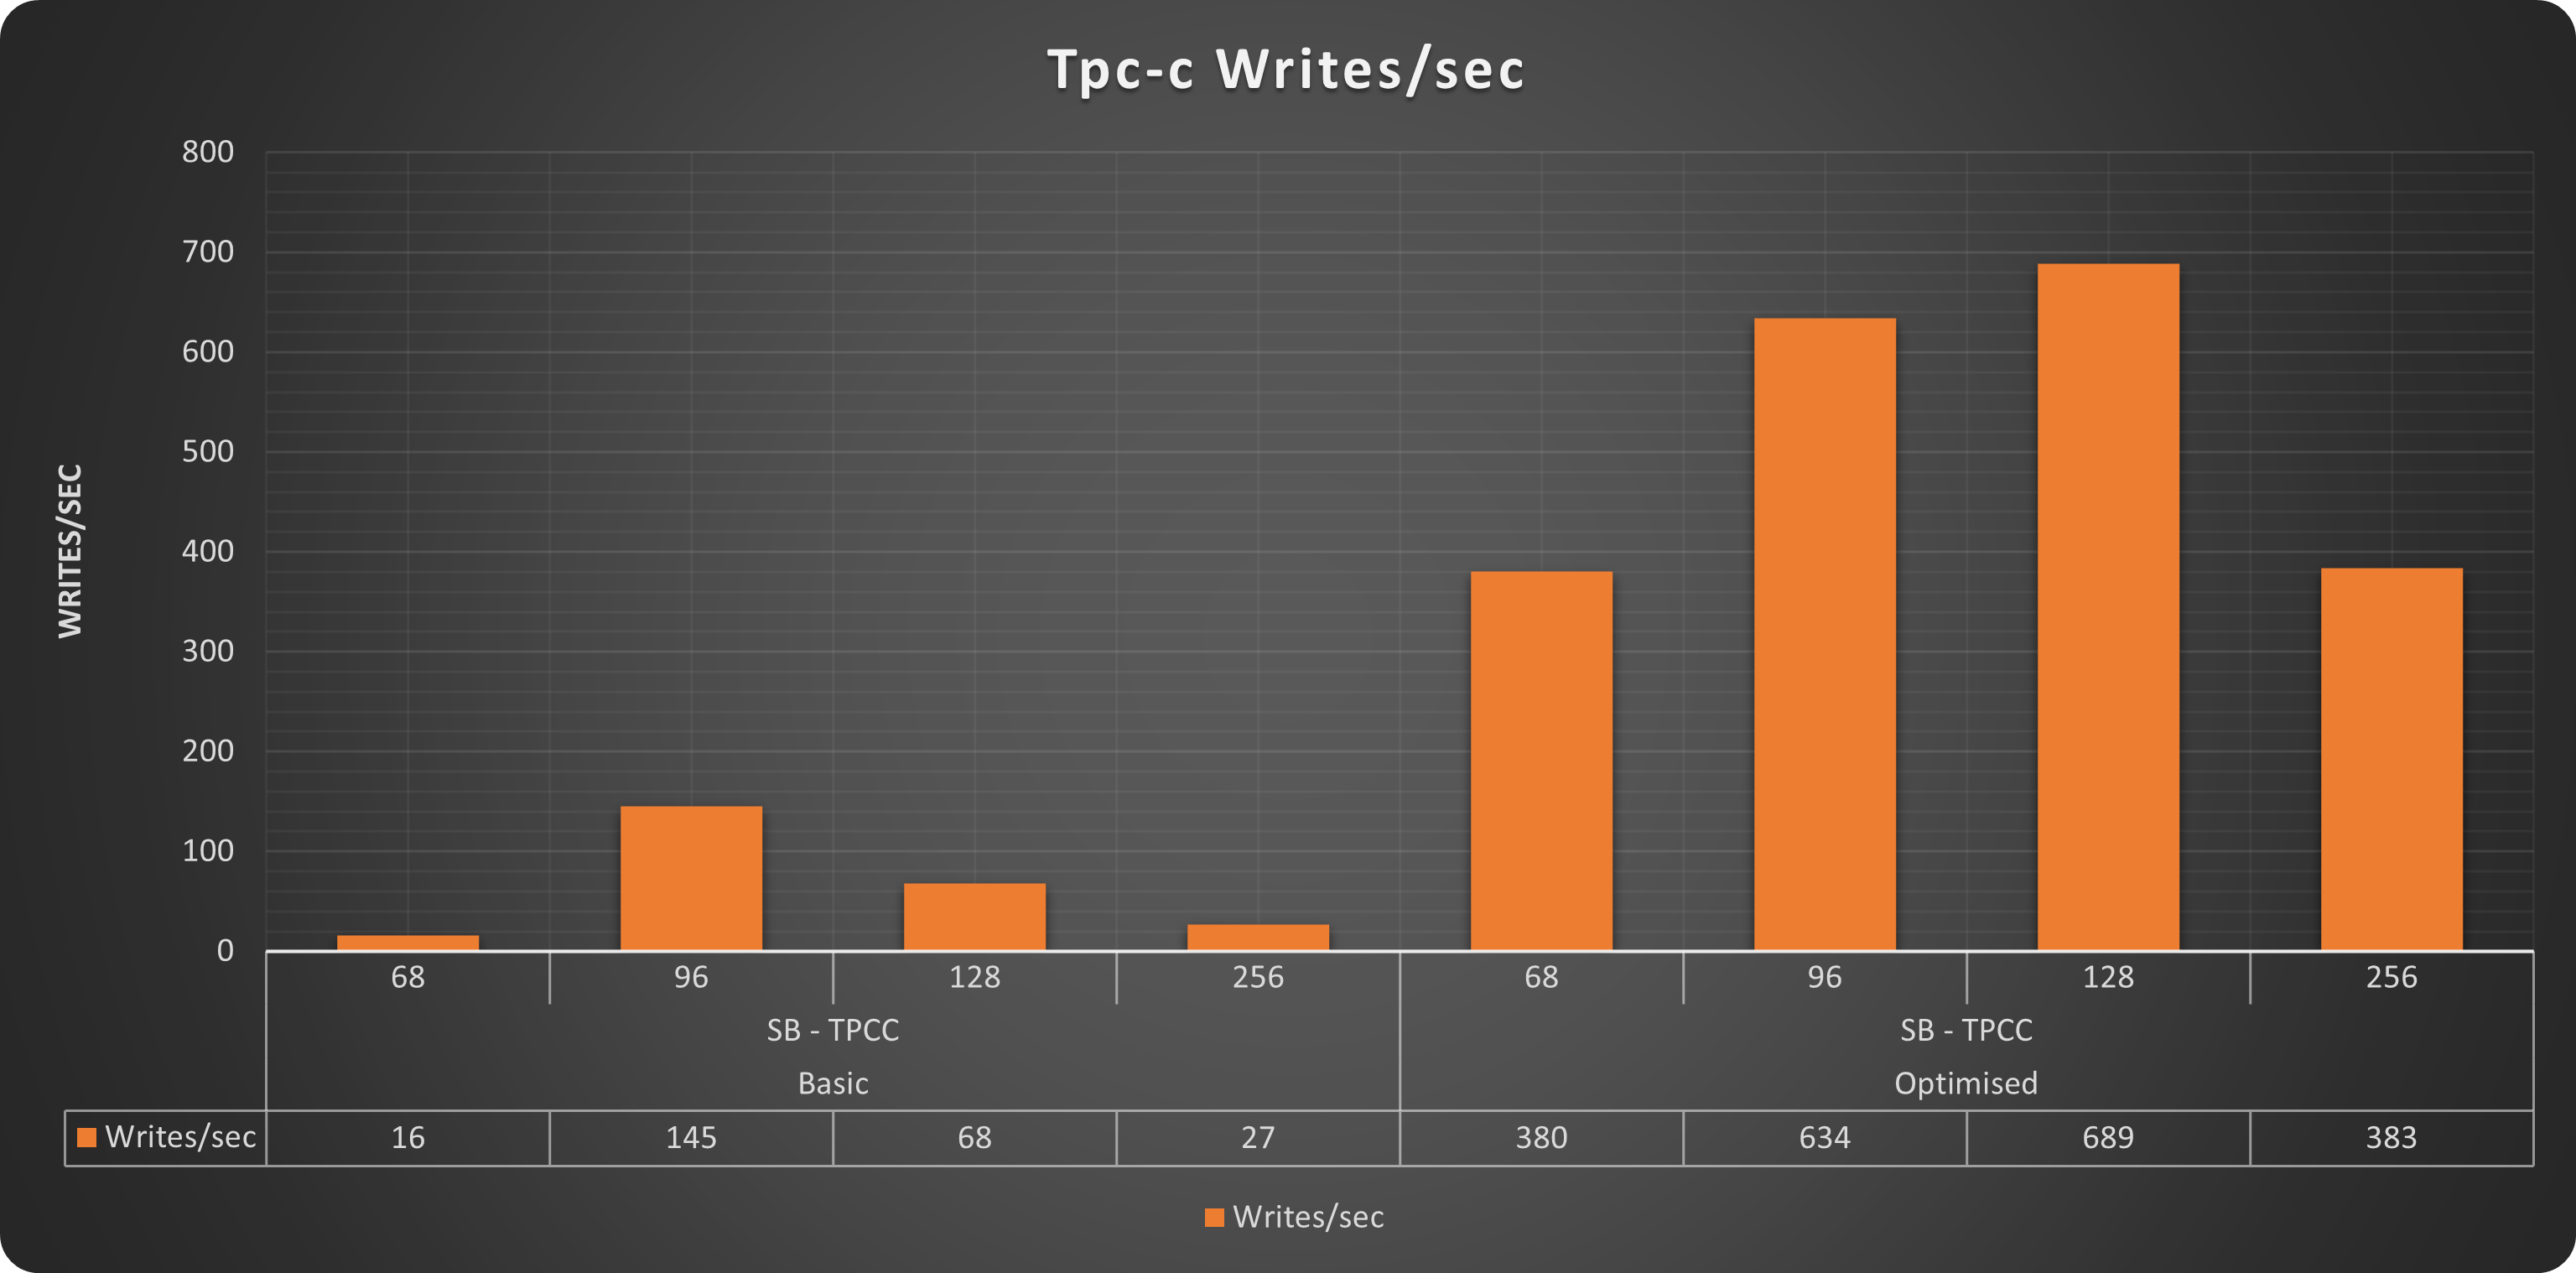
Comments
Also for Tpc-c like tests we have exactly the same trend. With our “optimised” solution able to serve up to 1516 qps while the “basic” one was able to reach only 322. In this case Also the “optimised” solution was not able to scale up to 256 threads, but that makes sense, given the more intense write workload present in this test and the small dimension of the platform.
Wooha what have you changed?
You may think we have done crazy things to get this difference, but we did not.
Let us jump back. As indicated at the beginning I had opened a FR (https://jira.percona.com/browse/K8SPXC-749) to be able to tune some/most of the timeouts existing in the operator. 
Why? Think about this, when you install a cluster on iron, you do not set it to be able to work only when the load is low, and all the components of the server are able to answer in nanoseconds. What you do instead is tune the whole system to accommodate the increasing load, and you will give to some elements more space for “flexibility” eventually expecting to have delays in answer. When doing so you also need to correctly align all the parameters that will be affected on cascade. For instance if you know your data nodes will be very busy serving queries, they may also slow down in answering internal health checks, but if you relax the cluster health checks and not the checks used for testing the cluster from operator point of view, the platform will be unbalanced and will not work correctly.
At the same time, if you do not tune the solution at all, you may end up with a platform that is theoretically able to serve the load, but that is crashing for artificial limitations.
The last one is exactly what was happening with our “basic” solution. As it is the operator comes with parameters that allow it to work well, but that are not designed to scale. Is like having a server where your CPUs are always at 20% and if the applications ask more, a controller will chop them in fear of having too much load. But the fact is that you want to have the CPUs at 80% or the server will be underutilized.
Anyhow what we have changed was some Innodb parameters, to allow internal operations to work better. Then we force consistent reads in PXC, which actually SLOW down the operations, and finally we tune the PXC cluster to be more flexible in its internal checks, avoiding having it to expel nodes unless really needed to.
All the above were done using the Operator configuration, but then we had to work manually changing all the timeouts parameters used by the operator checks to be aligned with what we had defined in the cluster.
In particular what we have changed was:
script                      line    value
/usr/bin/clustercheckcron   33      TIMEOUT=10
liveness-check.sh           23      TIMEOUT=5
readiness-check.sh          21      TIMEOUT=10
/usr/local/bin/check_pxc.sh 15      TIMEOUT=${CUSTOM_TIMEOUT:-10}
Wait .. why ProxySQL?
Ok this is another long discussion and I will cover it better in another article. For now just consider that HAProxy does not allow r/w splitting or other nice functionalities like firewalling etcetera etcetera. So the idea is simple, let us use the operator with what fits it better, and then decouple the special needs, eventually adding proxysql in a separate deployment.
If you are scared of the cost of adding an additional block to the architecture:


Where:
ProxySQL means: Application → ProxySQL → HAProxy.
HAProxy means: Application → HAProxy.
Hope this puts your worries at rest, of course this is using the “optimised” solution.
Conclusions
Percona Distribution for MySQL Operator, is a constantly growing/improving solution. It also has a lot of interesting features, like being able to manage your backup/restore, point in time recovery, and more. But its adoption is still limited and it is normal to have some drawbacks like this one. It is on us who play with real production environments, or as in this case playing to define certified solutions, to give feedback to improve how the operator works, in order to make it a stronger product able to serve you better day by day.
Now we are going to wait for the FR to be implemented, and then we will recover our dimensioning work.