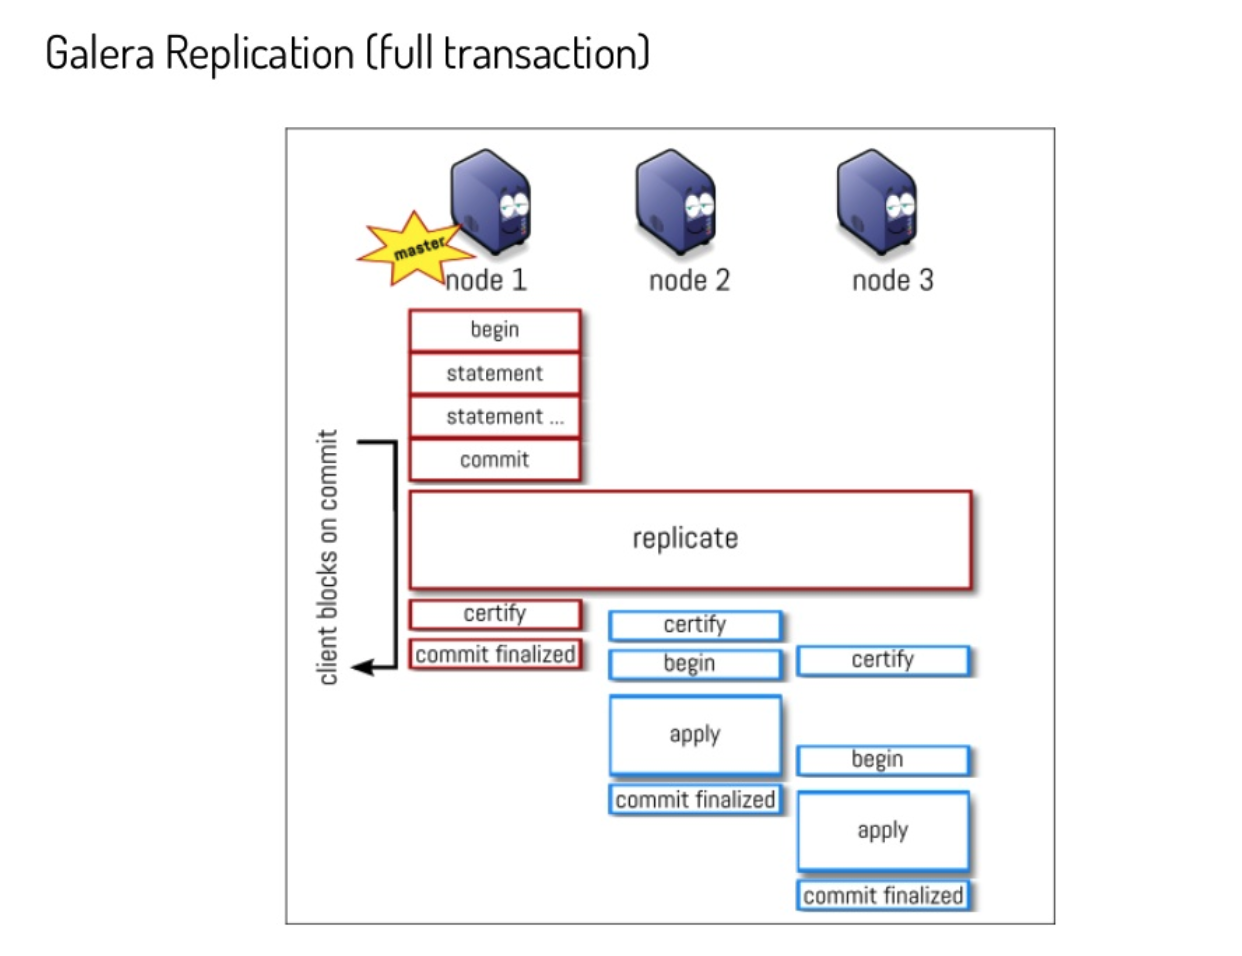
First a brief explanation about the scheduler.
The scheduler inside ProxySQL was created to allow administrators to extend ProxySQL capabilities. The scheduler gives the option to add any kind of script or application and run it at the specified interval of time. The scheduler was also the initial first way we had to deal with Galera/Percona XtraDB Cluster (PXC) node management in case of issues.
The relevant elements are:
- Active: that defines if the scheduler should execute or not the external script
- Interval_ms: frequency of the execution. This has NO check if previous executions terminate. Given that a script must include a check to prevent launching multiple instances which will probably create conflicts and resource issues.
- Filename: the FULL path of the script/app you want to be executed.
- Arg(s): whatever you want to pass as arguments. When you have a complex script, either use a configuration file or collapse multiple arguments in a single string.
The Scripts
In this blog, I will present two different scripts (as examples). Both will cover the scenarios as in the previous article and can do more, but I will focus only on that part for now.
One script is written in Bash and is the porting of the proxysql_galera_checker Percona was using with ProxySQL-admin in ProxySQL version 1.4. The script is available here from Percona-lab (git clone ).
The other, written by me, is written in Perl and is probably the first script that came out in 2016. I have done some enhancements and bug fixing to it during the years. Available here (git clone).
Both are offered here as examples and I am not suggesting to use them in critical production environments.
The Setup
To use the two scripts some custom setup must be done. First of all, check that the files are executable by the user running ProxySQL.
Let’s start with mine in Perl
To make it work we need to define a set of host groups that will work as Reader/Writer/Backup-writer/backup-reader (optional but recommended). The difference from the native support is that instead of having them indicated in a specialized table, we will use the mysql_servers table.
- Writer: 100
- Readers: 101
- Backup Writers:8100
- Backup Readers: 8101
Given the above, on top of the already defined servers in the previous article, we just need to add the 8000 HGs.
For example:
INSERT INTO mysql_servers (hostname,hostgroup_id,port,weight,max_connections,comment) VALUES ('192.168.4.22',8100,3306,1000,2000,'Failover server preferred');
INSERT INTO mysql_servers (hostname,hostgroup_id,port,weight,max_connections,comment) VALUES ('192.168.4.23',8100,3306,999,2000,'Second preferred');
INSERT INTO mysql_servers (hostname,hostgroup_id,port,weight,max_connections,comment) VALUES ('192.168.4.233',8100,3306,998,2000,'Third and last in the list');

INSERT INTO mysql_servers (hostname,hostgroup_id,port,weight,max_connections,comment) VALUES ('192.168.4.22',8101,3306,100,2000,'');
INSERT INTO mysql_servers (hostname,hostgroup_id,port,weight,max_connections,comment) VALUES ('192.168.4.23',8101,3306,1000,2000,'');
INSERT INTO mysql_servers (hostname,hostgroup_id,port,weight,max_connections,comment) VALUES ('192.168.4.233',8101,3306,1000,2000,'');
After that we need to insert the instructions for the scheduler:
INSERT INTO scheduler (id,active,interval_ms,filename,arg1) values (10,0,2000,"/opt/tools/proxy_sql_tools/galera_check.pl","-u=cluster1 -p=clusterpass -h=192.168.4.191 -H=100:W,101:R -P=6032 --retry_down=2 --retry_up=1 --main_segment=2 --debug=0 --log=/var/lib/proxysql/galeraLog --active_failover=1");
The result will be:
    id: 10
     active: 0
interval_ms: 2000
   filename: /opt/tools/proxy_sql_tools/galera_check.pl
       arg1: -u=cluster1 -p=clusterpass -h=192.168.4.191 -H=100:W,101:R -P=6032 --retry_down=2 --retry_up=1 --main_segment=2 --debug=0  --log=/var/lib/proxysql/galeraLog --active_failover=1
       arg2: NULL
       arg3: NULL
       arg4: NULL
       arg5: NULL
    comment:
Please refer to the instruction in Github for the details of the parameters. What we can specify here is:
- -H=100:W,101:R Are the Host Group we need to refer to as the ones dealing with our PXC cluster
- –active_failover=1 Failover method to apply
- –retry_down=2 –retry_up=1 If action must be taken immediately or if a retry is to be done. This is to avoid the possible jojo effect due to any delay from the node or network.
Always set it to 0 and activate only when all is set and you are ready to go. Once the above is done, the script ready to be used by ProxySQL is the galera_check script.
Percona proxysql_galera_checker
One limitation this script has is that you cannot use different IPs for the PXC internal communication and the ProxySQL node. Given that, we need to modify the setup we had in the previous blog to match the script requirements. Also here we need to define which HG will be the writer which the reader, but we will specify the internal IPs, and, of course, ProxySQL must have access to that network as well.
- Writer HG : 200
- Reader HG: 201
- Network IPs 10.0.0.22 – 23 – 33
Given that, our ProxySQL setup will be:
delete from mysql_users where username='app_test';
insert into mysql_users (username,password,active,default_hostgroup,default_schema,transaction_persistent,comment) values ('app_test','test',1,200,'mysql',1,'application test user DC1');
LOAD MYSQL USERS TO RUNTIME;SAVE MYSQL USERS TO DISK;

delete from mysql_query_rules where rule_id in(1040,1042);
insert into mysql_query_rules (rule_id,proxy_port,username,destination_hostgroup,active,retries,match_digest,apply) values(1040,6033,'app_test',200,1,3,'^SELECT.*FOR UPDATE',1);
insert into mysql_query_rules (rule_id,proxy_port,username,destination_hostgroup,active,retries,match_digest,apply) values(1042,6033,'app_test',201,1,3,'^SELECT.*$',1);
load mysql query rules to run;save mysql query rules to disk;

delete from mysql_servers where hostgroup_id in (200,201);
INSERT INTO mysql_servers (hostname,hostgroup_id,port,weight,max_connections,comment) VALUES ('10.0.0.22',200,3306,10000,2000,'DC1');
INSERT INTO mysql_servers (hostname,hostgroup_id,port,weight,max_connections,comment) VALUES ('10.0.0.22',201,3306,100,2000,'DC1');
INSERT INTO mysql_servers (hostname,hostgroup_id,port,weight,max_connections,comment) VALUES ('10.0.0.23',201,3306,10000,2000,'DC1');
INSERT INTO mysql_servers (hostname,hostgroup_id,port,weight,max_connections,comment) VALUES ('10.0.0.33',201,3306,10000,2000,'DC1');

load mysql servers to run;save mysql servers to disk;
As you can see here we need to redefine also the user and query rules to match the different HGs, if you use the same (100 -101) no need to do that.
Now it’s time to add the line in for the scheduler:
delete from scheduler where id=60;
INSERT  INTO scheduler (id,active,interval_ms,filename,arg1) values (60,0,3000,"/opt/tools/proxysql-scheduler/proxysql_galera_checker","--config-file=/opt/tools/proxysql-scheduler/proxysql-admin-sample.cnf --writer-is-reader=always --write-hg=200 --read-hg=201 --writer-count=1 --priority=10.0.0.22:3306,10.0.0.23:3306,10.0.0.33:3306 --mode=singlewrite --debug --log=/tmp/pxc_test_proxysql_galera_check.log");
LOAD SCHEDULER TO RUNTIME;SAVE SCHEDULER TO DISK;
Also in this case please refer to the specifications of the parameters, but it’s worth mentioning:
- –write-hg=200 –read-hg=201 Host groups definition
- –writer-is-reader=always Keep this as ALWAYS please, we will see you do not need anything different.
- –mode=singlewrite Possible modes are load balancer and single writer. This is refuse from the old. Never, ever use Galera/PXC in multi-primary mode, period.
- –priority=10.0.0.22:3306,10.0.0.23:3306,10.0.0.33:3306 This is where we define the priority for the writers.
Also in this case when loading a schedule, keep the schedule deactivated, and enable it only when ready.
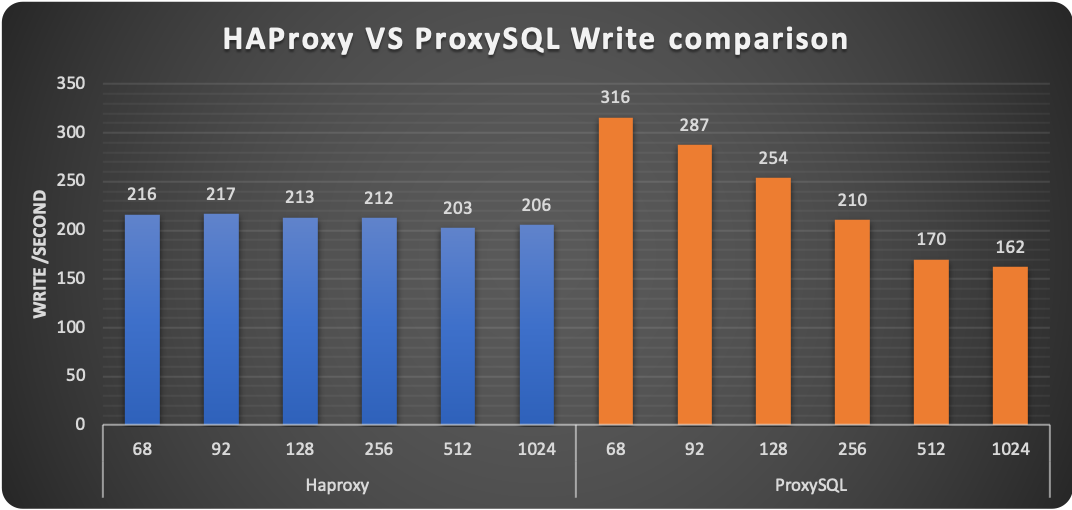
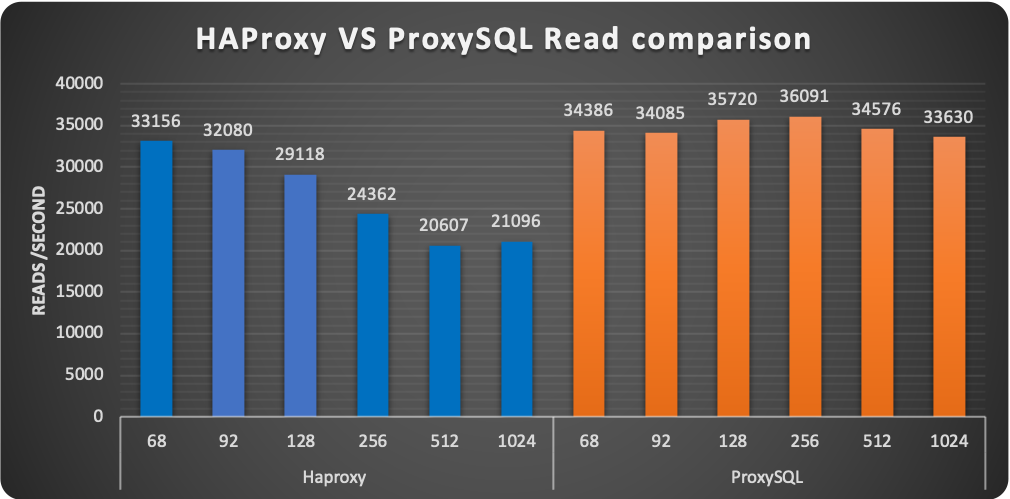
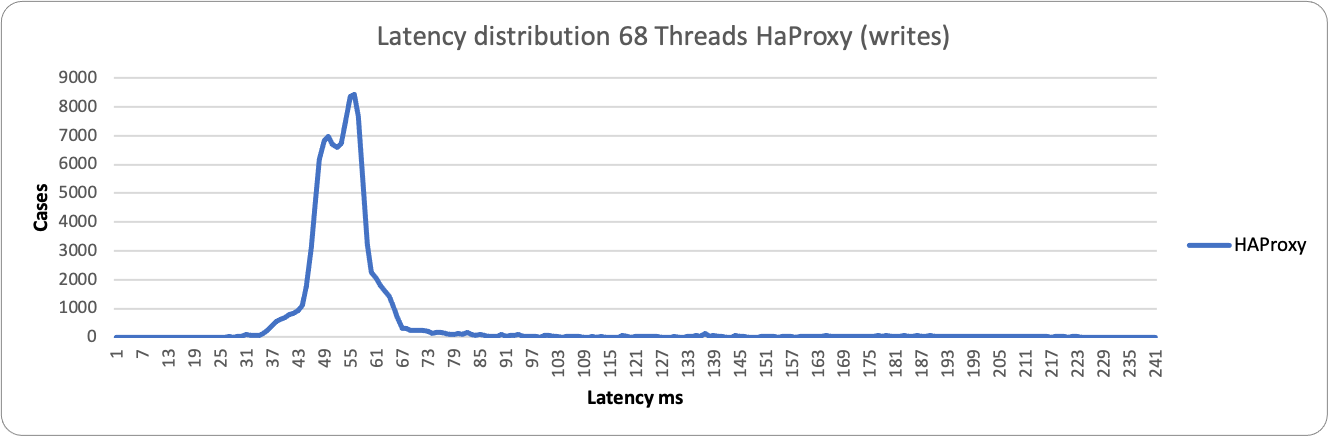
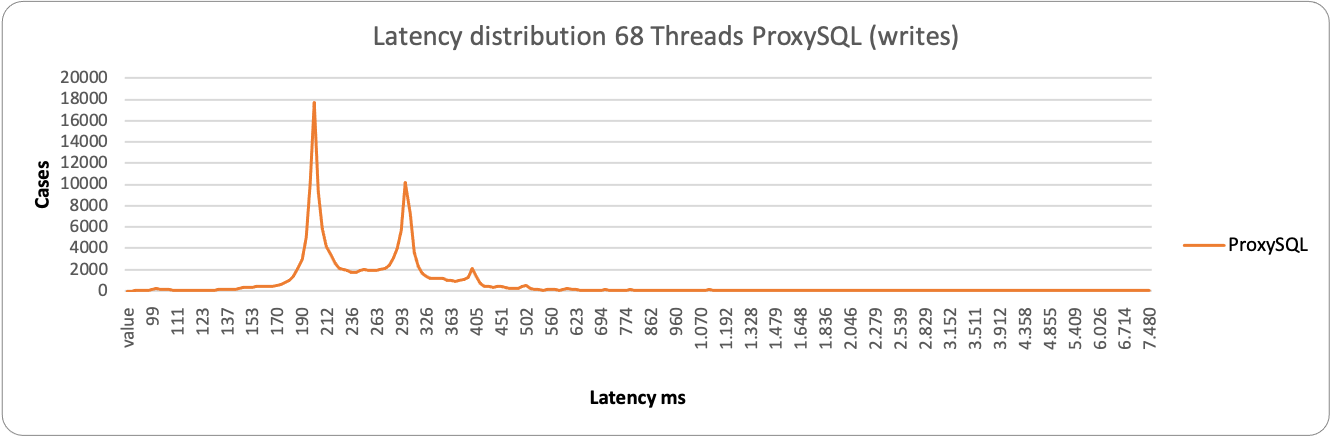
The Tests
Read Test
The first test is the simple read test, so while we have sysbench running in read_only mode we remove one reader after the other.
Marco script:
+---------+-----------+---------------+----------+--------------+----------+----------+
| weight  | hostgroup | srv_host      | srv_port | status       | ConnUsed | ConnFree |
+---------+-----------+---------------+----------+--------------+----------+----------+
| 10000   | 100       | 192.168.4.22  | 3306     | ONLINE       | 0        | 0        |
| 10000   | 101       | 192.168.4.233 | 3306     | ONLINE       | 38       | 8        |
| 10000   | 101       | 192.168.4.23  | 3306     | ONLINE	| 15       | 49       |
| 100     | 101       | 192.168.4.22  | 3306     | ONLINE       | 0        | 64       |
+---------+-----------+---------------+----------+--------------+-------
| weight  | hostgroup | srv_host      | srv_port | status       | ConnUsed |
+---------+-----------+---------------+----------+--------------+-------
| 10000   | 200       | 10.0.0.22     | 3306     | ONLINE       | 0        |
| 10000   | 201       | 10.0.0.33     | 3306     | OFFLINE_SOFT | 0
| 10000   | 201       | 10.0.0.23     | 3306     | OFFLINE_SOFT | 0
| 100     | 201       | 10.0.0.22     | 3306     | ONLINE       | 62       |
+---------+-----------+---------------+----------+--------------+----------+
| weight  | hostgroup | srv_host      | srv_port | status       | ConnUsed |
+---------+-----------+---------------+----------+--------------+----------+
| 999     | 100       | 192.168.4.23  | 3306     | ONLINE       | 50       |
| 10000   | 100       | 192.168.4.22  | 3306     | OFFLINE_SOFT | 0        |
| 10000   | 101       | 192.168.4.233 | 3306     | ONLINE       | 5        |
| 10000   | 101       | 192.168.4.23  | 3306     | ONLINE       | 6 	   |
| 100     | 101       | 192.168.4.22  | 3306     | OFFLINE_SOFT | 0        |
Node was elected and connections on the old writer were also able to end given OFFLINE_SOFT.
Putting back the node, removing it from maintenance:
Then I put the node under maintenance:
+---------+-----------+---------------+----------+--------------+----------+
| weight  | hostgroup | srv_host      | srv_port | status       | ConnUsed |
+---------+-----------+---------------+----------+--------------+----------+
| 1000000 | 200       | 10.0.0.23     | 3306     | ONLINE       | 26       |
| 10000   | 200       | 10.0.0.22     | 3306     | OFFLINE_SOFT | 22       |
| 10000   | 201       | 10.0.0.33     | 3306     | ONLINE       | 8        |
| 10000   | 201       | 10.0.0.23     | 3306     | ONLINE       | 12       |
| 100     | 201       | 10.0.0.22     | 3306     | OFFLINE_SOFT | 0        |
Connections will be moved to the new Writer slowly based on the application approach.
But when I put the node back from maintenance:
+---------+-----------+---------------+----------+--------------+----------
| weight  | hostgroup | srv_host      | srv_port | status       | ConnUsed
+---------+-----------+---------------+----------+--------------+----------
| 1000000 | 200       | 10.0.0.23     | 3306     | OFFLINE_SOFT | 0
| 10000   | 200       | 10.0.0.22     | 3306     | ONLINE       | 49
| 10000   | 201       | 10.0.0.33     | 3306     | ONLINE       | 5
| 10000   | 201       | 10.0.0.23     | 3306     | ONLINE       | 14
| 100     | 201       | 10.0.0.22     | 3306     | ONLINE       | 0
The old Writer will be put back as Primary. As indicated above I consider this wrong, given we may risk putting back a node that is cold and that can affect production performance. It is true that putting it back from maintenance is a controlled action, but the more checks the better.
Testing Node Crash
Marco script:
To emulate a crash I will kill the mysqld process with kill -9 <pid>.
+---------+-----------+---------------+----------+--------------+----------+
| weight  | hostgroup | srv_host      | srv_port | status	| ConnUsed |
+---------+-----------+---------------+----------+--------------+----------+
| 1000    | 100       | 192.168.4.22  | 3306     | ONLINE	| 50       |
| 10000   | 101       | 192.168.4.233 | 3306     | ONLINE	| 12       |
| 10000   | 101       | 192.168.4.23  | 3306     | ONLINE	| 4        |
| 100     | 101       | 192.168.4.22  | 3306     | ONLINE	| 0        |
Kill the process:
59,50,53.99,6603.16,6205.21,218.97,178.98,1561.52,0.00,2.00
60,50,54.11,5674.25,5295.50,215.43,163.32,1648.20,0.00,1.00
61,50,3.99,3382.12,3327.22,30.95,23.96,2159.29,0.00,48.91   <--- start
62,50,0.00,820.35,820.35,0.00,0.00,0.00,0.00,0.00
63,50,0.00,2848.86,2550.67,195.13,103.07,0.00,0.00,0.00
64,50,0.00,0.00,0.00,0.00,0.00,0.00,0.00,0.00
65,50,0.00,0.00,0.00,0.00,0.00,0.00,0.00,0.00
66,50,0.00,0.00,0.00,0.00,0.00,0.00,0.00,0.00
67,50,50.00,4268.99,4066.99,52.00,150.00,7615.89,0.00,1.00  <--- failover end
68,50,72.00,6522.40,6096.37,268.02,158.01,1109.09,0.00,1.00
Five seconds is consistently taken, of which two are because I set the scheduler to run every two seconds, and also a retry.
And the new Primary is serving while the failed node is removed:
+---------+-----------+---------------+----------+--------------+----------+----------+
| weight  | hostgroup | srv_host      | srv_port | status	    | ConnUsed | ConnFree |
+---------+-----------+---------------+----------+--------------+----------+----------+
| 999     | 100       | 192.168.4.23  | 3306     | ONLINE       | 0        | 50       |
| 10000   | 101       | 192.168.4.233 | 3306     | ONLINE       | 0        | 34       |
| 10000   | 101       | 192.168.4.23  | 3306     | ONLINE       | 0        | 35       |
| 100     | 101       | 192.168.4.22  | 3306     | SHUNNED      | 0        | 0        |
Percona script:
Also, in this case, the Percona script behaves a bit differently.
Before the crash:
Then kill the process:
29,50,41.05,4099.74,3838.44,155.18,106.12,2009.23,0.00,0.00
30,50,8.01,1617.92,1547.79,37.07,33.06,1803.47,0.00,50.09
31,50,0.00,2696.60,2696.60,0.00,0.00,0.00,0.00,0.00       <--- start
32,50,0.00,0.00,0.00,0.00,0.00,0.00,0.00,0.00
33,50,0.00,0.00,0.00,0.00,0.00,0.00,0.00,0.00
34,50,0.00,0.00,0.00,0.00,0.00,0.00,0.00,0.00
35,50,0.00,0.00,0.00,0.00,0.00,0.00,0.00,0.00
36,50,0.00,0.00,0.00,0.00,0.00,0.00,0.00,0.00
37,50,12.96,2385.82,2172.46,91.72,121.63,8795.93,0.00,0.00  <--- failback ends 6"
38,50,39.95,4360.00,4083.38,148.80,127.82,9284.15,0.00,0.00
Variable time to recover but around 6-12 seconds.
+---------+-----------+---------------+----------+---------+----------+
| weight  | hostgroup | srv_host      | srv_port | status  | ConnUsed |
+---------+-----------+---------------+----------+---------+----------+
| 1000000 | 200       | 10.0.0.23     | 3306     | ONLINE  | 50       | ← new
| 10000   | 201       | 10.0.0.33     | 3306     | ONLINE  | 11       |
| 10000   | 201       | 10.0.0.23     | 3306     | ONLINE  | 5        |
New Primary is elected. But on node recovery:
+---------+-----------+---------------+----------+--------------+----------+
| weight  | hostgroup | srv_host      | srv_port | status       | ConnUsed |
+---------+-----------+---------------+----------+--------------+----------+
| 1000000 | 200       | 10.0.0.23     | 3306     | OFFLINE_SOFT | 50       |
| 10000   | 200       | 10.0.0.22     | 3306     | ONLINE       | 0        |<--old is back
| 10000   | 201       | 10.0.0.33     | 3306     | ONLINE       | 10       |
| 10000   | 201       | 10.0.0.23     | 3306     | ONLINE	| 6        |
| 1000    | 201       | 10.0.0.22     | 3306     | ONLINE       | 0        |
As for maintenance, when the node comes back, by default it is moved to the Primary role. As already explained I consider this wrong and dangerous, but it is a way of seeing what a script should do.